Rental Property Investment
From Spreadsheet to Analytical Engine for Our Decisions
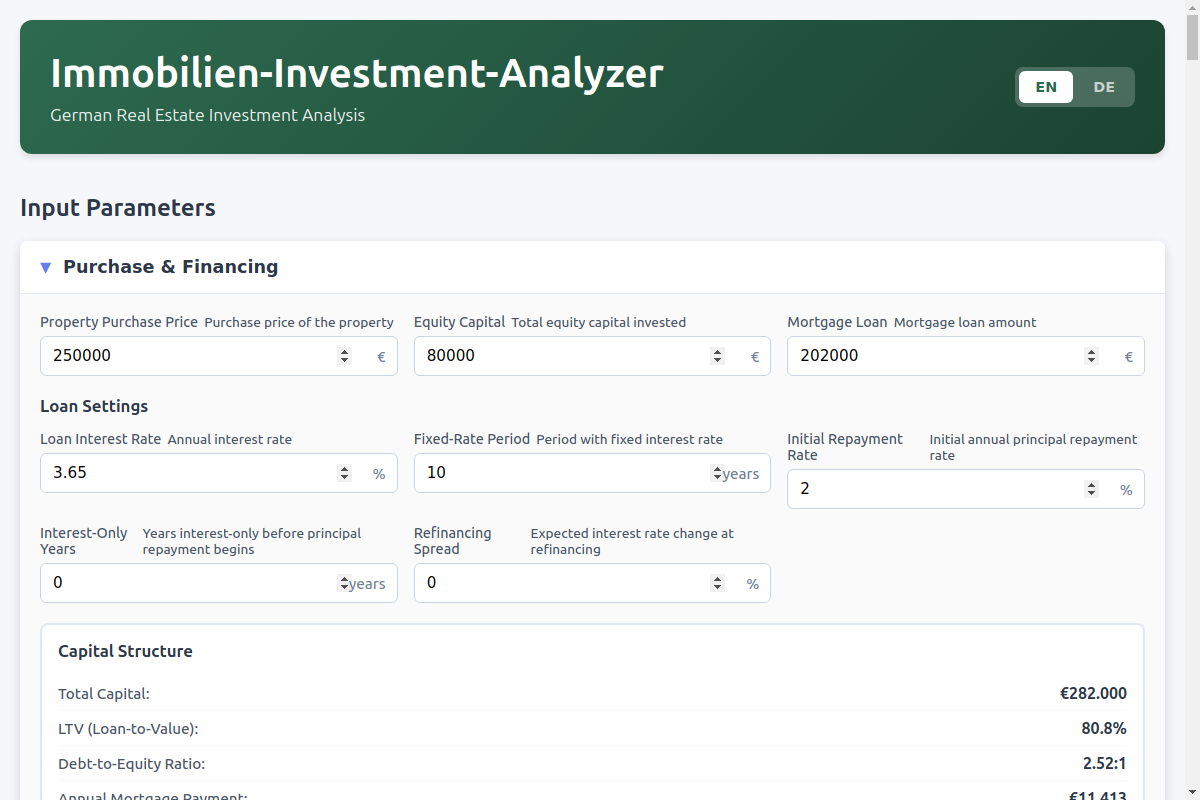
The Setup
A friend is considering starting a rental property business in Germany -- buying apartments, renting them out through a property management company, structuring it under a German GmbH, and eventually bringing on partners. The question is not "is this a good idea?" but "under what conditions is this a good idea, and where should you focus effort to make it work?"
A spreadsheet cannot answer that. You need sensitivity analysis, tornado charts, MECE improvement scenarios, real market data, and the ability to tweak assumptions interactively. So I set out to build a proper analytical engine from scratch.
Session 1: Building the Foundation — Feb 2-3 | 4 hours | 74 prompts | Architecture, financial model, balance sheet, sensitivity analysis
Laying the Foundation
I pasted my friend's property purchase spreadsheet -- an 8-year projection with line items for purchase price, loan terms, rental revenue, operating costs, scheduled maintenance, depreciation, and tax treatment under a German GmbH structure. The spreadsheet had bones but needed rethinking: costs weren't categorized properly, revenue was assumed static, and the balance sheet didn't balance.
Claude and I designed the React app architecture together: accordion-based inputs (startup costs, fixed recurring, variable recurring, scheduled capex, emergency fund, depreciation settings), a shared CostsContext data model, and side-by-side 7-year P&L and balance sheet tables for a German GmbH.
Balance Sheet Debugging
The balance sheet didn't balance. The model originally forced Cash + Loan = Property Price (wrong -- you can inject more equity than the property costs). Claude caught its own error during a rename from cashInvestment to equityCapital where downstream references were only partially updated, breaking the calculation chain. We used Puppeteer screenshots in the feedback loop from this point forward -- Claude could see the rendered output directly and trace through the calculation logic to find mismatches.
Insights Layer
Break-even analysis, target returns chart showing property equity growth vs. 3%/5%/8% stock market yields, funding gap analysis, risk metrics, and a liquidity dashboard. The revenue model used guided calculation: occupancy weeks per year (max 52), price-per-week, local VAT shown as customer total post-VAT. Two separate charts: one for investment performance ("Am I building wealth?"), one for cash position ("Can I survive?").
The Sensitivity Analysis Deep Dive
I wanted something beyond tornado charts -- not pre-planned scenarios but discovery of the solution space. We explored gradient descent across the full parameter space (13+ dimensions: property price, equity, interest rate, rental income, occupancy rate, management fees, insurance, maintenance reserve, depreciation rates, etc.), constrained to realistic bounds. Gradient-based optimization found zero viable solutions with a 10k minimum cash requirement -- a major finding about the business model's sensitivity to initial capitalization.
Then PCA and t-SNE to visualize the high-dimensional scenario space.
Session 2: Getting It Deployed — Feb 3-4 | 3.5 hours | 48 prompts | CI/CD, visual triage, layout iteration
CD Setup
Build output directory wrong (dist vs build), react-scripts not found, ESLint errors across 6 source files. SSH key failures, htpasswd generation, smoke test 401s -- rapid-fire infrastructure fixes.
Iterating on Visual Design and Layout
Session 3: Making It Useful — Feb 4 | 3.5 hours | 19 prompts | UX refinement, i18n, PDF export
Crash Recovery
Recovered with claude --resume from a crashed session.
Leveraging Claude to Inspect the Product
The color semantics needed rethinking: red/green was wrong because a negative number isn't always bad -- reducing costs is a positive outcome. Blue for negative-but-good, green for positive-but-good.
Scope Expansion
- Full i18n implementation across all input components (LanguageContext, en.json, de.json, 10+ components translated)
- Research tab stub with GmbH tax structure explanation
- PDF export
- Waterfall chart
Session 4: Research & Revenue — Feb 4 | 4.5 hours | 18 prompts | Market data, model validation, revenue planning
Parallel Research Agents for Market Data
Claude launches 5 parallel sub-agents to research property listings, rental rates, occupancy rates, management fees, and operating costs. Some agents fail (no web access), but data files are created: regionalRentalRates.js, operatingCostsBenchmarks.js.
Model Validation
Careful Revenue Model Planning
propertyRevenueModel.js was created with property categories, decay multipliers, condition/region adjustments, and occupancy models.
Session 5: The Big Rework — Feb 4-5 | 3+ hours | 37 prompts | Revenue model overhaul, performance optimization
Arriving with a Plan
Opens by pasting a ~260-line implementation plan for the revenue model rework -- data structures, calculation flows, ASCII UI mockups, verification checklist. The plan originated from /plan mode in Session 4, refined through earlier Claude conversations. Claude executes the full rework: RevenueInput.jsx rewritten with property selection, seasonal rate tables, VAT breakdown.
Drilling into Details
Performance Optimization: 4.3s to 1.94s to "ok forget it"
Session 6: Cleanup — Feb 5 | 2 hours | 5 prompts | Tornado chart NaN bug, final fixes
Tornado Chart NaN Bug
I identified the likely cause: "there's confusion between the old revenue concept and the new one we reworked to accommodate the research data" and provided a commit range to search. Root cause: the revenue model rework changed the data structure, but sensitivity analysis still used the old format.
Debugging via DOM Inspection
The tornado chart still had rendering issues after the data fix. Claude inspected the full rendered DOM of the chart -- raw HTML/SVG markup -- and traced remaining calculation issues in sensitivity analysis back to investmentCalculations.js.
What This Shows
Brian's experience running his own business (VAT, balance sheets, financial statements), his consulting toolkit (MECE frameworks, sensitivity analysis), and past experience renting property abroad is what transforms the tool from a calculator into an analytical engine. He catches errors Claude cannot: VAT being included in fee calculations, unrealistic improvement percentages, missing cost categories. "Revenue for the business is POST VAT" -- the kind of correction that requires actual business knowledge, not programming skill.
Brian manages Claude the way a senior engineer manages a junior: assign work, review output, redirect when wrong, know when to stop. Multi-issue triage in single messages with explicit priorities. Tells Claude what NOT to do as often as what to do. Asks "is it insightful and useful?" like a product manager reviewing a feature.
"Don't change code, but check what the actual state is." "Don't change code because we have to CAREFULLY plan this change." "Just think right now, don't change it yet." Brian used /plan mode in roughly half his sessions, with 10 of 17 plans rejected before approval. He reserves it for architectural decisions and uses it as a collaborative design tool, not a rubber stamp.
This project was built entirely from scratch -- from a pasted spreadsheet to a fully interactive bilingual analytical engine with sensitivity analysis, market research, and PDF export. It combined domains that would normally require multiple specialists: financial modeling, web development, market research, data visualization, and German tax expertise. The questions the tool can now explore -- What happens to cash flow if the interest rate rises 1% at refinancing? How does the debt-to-equity ratio affect IRR across different rent levels? Which combination of levers -- purchase negotiation, revenue optimization, or financing structure -- has the biggest impact on returns? -- would never get answered otherwise, because no one would pay to build a bespoke interactive dashboard for a personal investment decision.