Mermaid.js Team Topologies
Adding a New Diagram Type to a 14 000-Commit Open Source Project
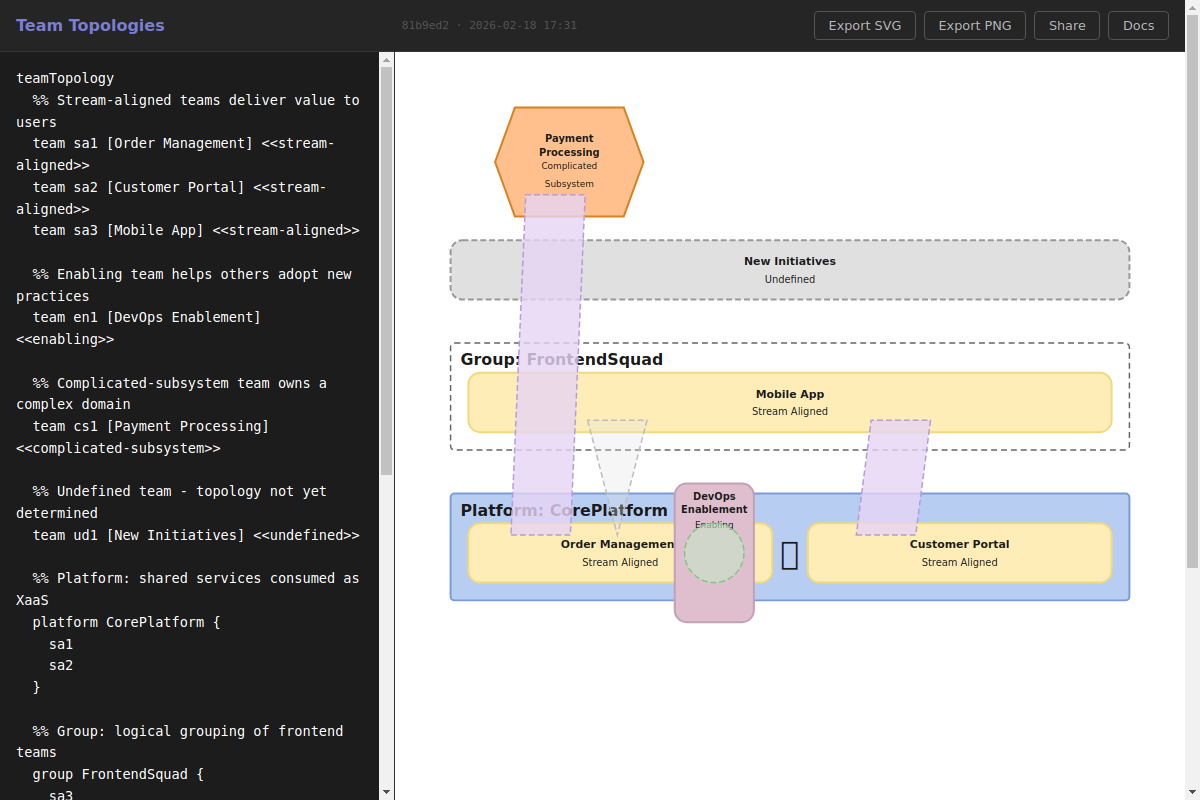
The Setup
I am a Team Topologies Advocate. Team Topologies is a model for organizing software teams: four team types, three interaction modes, grouping constructs. I use it constantly with clients. Every time I needed a diagram, I was in Miro or PowerPoint, dragging boxes around. I wanted text-to-diagram: type a few characters, get a correct Team Topologies visualization.
In July 2023, I opened an issue on the mermaid-js repository proposing the diagram type. I contributed a draft PR and started building. The Jison grammar language was harder to learn than I had time for between my normal consulting routines. Multiple sources of documentation online conflict each other, and there are even competing versions that work in different ways. I got it partly working, shelved it, came back months later, got stuck on layout, shelved it again. This was my third or fourth attempt.
What changed was Claude Code. I had a working parser and basic layout from October 2025. In February 2026, I sat down with Claude Code and went from that skeleton to v0.8.0 across 21 active days: 69 commits, 15 000 lines of custom code, and 2 153 tests. About 5 hours of my time total, interleaved with other consulting work.
This is not a blank-slate project. Mermaid-js has existing conventions for every diagram type: Jison grammar, detector, db, renderer, config schema, styles. It has its own parser infrastructure, established test patterns, and 14 000 commits of accumulated decisions. Everything I built had to work within that ecosystem.
Activity During the Build
Phase 1: Bootstrapping and Worklist Automation | Feb 6 | Sessions 1-2 | 18 prompts | Knowledge files, 9 automated tasks
Studying the Codebase
The first prompt was reconnaissance. I had an abandoned fork with some work done and needed Claude to figure out where I had left off and what the conventions were.
Claude launched two parallel research sub-agents and produced four knowledge files documenting mermaid's diagram conventions, my existing implementation status, bugs found, and upstream contributing notes.
The Worklist Pattern
I wanted to set Claude up for autonomous iteration: fix bugs, complete stubs, run tests, commit. But I quickly realized the approach would not scale.
The result was .claude/worklist.md: a machine-readable task queue with explicit rules. Pick the first unchecked task, implement it, run tests, commit, mark done, move on. Nine tasks executed autonomously via claude -p sub-agents: fixing an interaction type mismatch, fixing a platforms bug, cleaning up duplicate tests, implementing interaction rendering, adding the undefined team shape, adding CSS styles, wiring up config, improving the demo page, and updating example metadata.
I did not see an issue with handing off these tasks because my goal was to fan out a bunch of relatively closed experiments that did not compound. Each task was self-contained.
Phase 2: Visual Overhaul and Interaction Design | Feb 7 | Sessions 3-6 | 22 prompts | Screenshot feedback loops, shape implementation, vertical layout pivot
The Puppeteer Feedback Loop
Session 3 introduced the pattern that would define the project: Claude started a dev server, took Puppeteer screenshots of the rendered diagrams, identified problems, edited code, and re-screenshotted. The first thing it found was a critical dimension mismatch, the layout engine and renderers were using completely different team sizes. After the fix and a layout overhaul (horizontal rows with enabling-team sidebar), I saw the result and said "wow looks awesome."
Then I described the interaction shapes from the Team Topologies visual language.
The Vertical Layout Pivot
Two sessions later, I made a correction that fundamentally changed the project's direction.
This introduced the 5th interaction type (Handover) and redirected the layout from horizontal grid to vertical stacking, the correct Team Topologies convention. The shapes should only touch 20% into team edges, suggesting connection, not dominating the diagram. Facilitation was special: always inside the enabling team's shape.
Catching Claude "Cheating"
During the overnight implementation, Claude simplified my demo example to make its code work rather than making the code handle the full complexity.
This created CLAUDE.md rules, a demos/CLAUDE.md protection file, and the principle that would become lockdown tests.
Phase 3: The Layout Engine Challenge | Feb 9 | Session 7 | 30 prompts, 17MB, 3 context compactions | Combination matrix, per-type rules, facilitation modes, 246 tests
Five Corrections to the Mental Model
This was the most intense session of the entire project. I opened with a discussion about horizontal layout (the core unsolved problem) and what followed was a series of corrections where I had to repeatedly challenge Claude's assumptions.
Each correction was a refinement, not a contradiction. Claude kept reverting to familiar patterns (grids, columns, ranks) and I had to steer it toward the actual domain rules: per-type positioning constraints where interactions are layout participants, not afterthoughts.
The Combination Matrix
I asked for a comprehensive visual grid of every team/interaction/group combination: 11 lists, 92 diagrams. Claude built it as an HTML page with accordion sections. I reviewed each one individually, approved or rejected, and locked down confirmed cases with tests.
By session end, tests had grown from 91 to 246. Two distinct facilitation rendering modes were defined (XaaS-style for non-enabling pairs, overlap-style when one team is enabling). Three context window compactions hit during the session; it was 17MB of conversation.
Phase 4: Cross-Group Complexity | Feb 10-12 | Sessions 8-12 | 49 prompts | Barycenter ordering, width expansion, cross-group facilitation, v0.1.0
When Real Diagrams Break Everything
I pushed a real-world 7-team, 3-group, 6-interaction diagram. Everything broke. XaaS, Collaboration, and Undefined interactions all overlapped. Enabling teams were not overlapping their targets. Shapes that should be spread horizontally were stacked.
This was the moment the layout engine transitioned from "known combinations" to the real world.
Over five sessions, the layout engine grew to handle: zero-affinity team reordering, group width synchronization, union-find shape spreading, cross-group facilitation overlap, barycenter ordering to minimize interaction span confusion, post-fixup width expansion when enabling teams overshoot their partners, EN partner inset (18px inside partner's right edge), and XaaS target-centering.
Correcting Claude with Evidence
Claude claimed a gap between two teams was 44px. I pasted the actual SVG elements.
This forced Claude to trace the real bug: floated enabling teams with stale positions were inflating the layout's maxBottom calculation by 110px. The evidence-first correction pattern would intensify over the remaining sessions.
Domain Expertise at the Pixel Level
I caught that the enabling team's right edge was flush with the partner's right edge, only 0.5px inset.
Phase 5: Regression Recovery and List 13 | Feb 16 | Sessions 13-14 | 31 prompts | Label overhaul, 3 simultaneous regressions, cross-group handover, 12 novel combinations
Three Regressions at Once
After implementing text wrapping for long labels, I caught three simultaneous regressions.
The root fix was a one-line assignTeamsToGroups filter. Claude's initial fix (white knockout shapes behind semi-transparent interactions) was over-engineered and destroyed the desired transparency. I caught it because I understood the domain intent better than the technical solution.
"No, You Don't Confirm What Looks Correct"
Designing List 13
I designed 12 novel combination diagrams (multi-EN, cross-column interactions, fan-out XaaS, diamond dependencies) deliberately pushing into combinations the layout engine had never seen. Eight of twelve had layout defects. This was the test that mattered: not "do the known cases work" but "does the engine handle compositions it was never designed for?"
I also proposed a global geometric invariant: any interaction shape (except handover) should intersect both teams it connects. If the entire set of lists passes this test, we likely do not have a major issue. This was designing a convergent constraint: a single rule that catches entire classes of positioning bugs automatically.
Phase 6: Architecture Audit and The SVG Pivot | Feb 16-17 | Sessions 15-17 | 33 prompts | Layout complexity audit, intersection testing, v0.5.0-v0.6.0
Stepping Back
After 14 sessions of building, I paused to audit the layout engine's complexity.
I have a suspicion we could solve this with less code, but part of this solution was really exploratory: working with Claude to discover techniques to make the layout work, working through the "global layout rules" and more local exceptions to the rules. I debated using a constraint solver like Kiwi but it seemed there was downstream layout work I would have to layer on exceptions-to-the-rule for anyway.
The SVG Pivot
Then came the moment that changed the project's testing strategy.
Claude had been using Puppeteer screenshots for visual verification from the start: launching a browser, taking a screenshot, interpreting the PNG. But diagrams are SVGs. The rendered SVG DOM is directly parseable. You can find elements by selector, measure bounding boxes, check attribute values, assert containment, all without a browser, all deterministic, all fast. Once I got Claude moving from pixel-level to SVG interpretation, its feedback loop was able to identify and fix bugs that I was hitting a wall with when using pixel verification.
Phase 7: The Test Architecture | Feb 18 | Sessions 18-20 | 26 prompts | Three-tier test pyramid, SVG snapshots, 282 to 2 133 tests
7.6x Test Explosion in One Day
I designed a three-tier test architecture:
- General rules: universal invariants (content containment, team integrity, group containment, interaction shapes, handover rules, facilitation rules) run parametrically against all 112 matrix diagrams
- Per-diagram rules: list-specific tests proving behaviors NOT covered by global rules
- Calculation logic unit tests: direct function-level tests of internal algorithms (topological sort, barycenter, XaaS constraints, handover clusters)
Plus SVG snapshots: every matrix diagram gets its SVG output frozen as a baseline. Any future change triggers a failure with full output for human review.
Over three sessions, I delivered implementation plans for each tier. Claude built the test infrastructure: matrixDiagrams.ts (112 diagram definitions), renderHelper.ts (JSDOM render pipeline with geometry helpers), 6 general rule spec files, 8 layout engine unit test spec files, per-diagram specs for Lists 1-13, and a snapshot suite.
Tests went from 282 to 2 133.
Non-Redundant Layering
Each layer serves a distinct purpose. I enforced non-redundancy aggressively. Claude's instinct is to test everything; my discipline was to test the right things in the right place.
Phase 8: Final Fixes and v0.8.0 | Feb 18 | Session 21 | 12 prompts | List 13 completion, hub-source rule discovery, 2 153 tests
"Retry"
Claude analyzed diagram 13.8 and concluded the fix would break 5 tests. I said one word.
Then diamond centering (cs1 centered above its below-partner), partner-aware centering for 13.6, and a ranking fix for 13.10. Each fix added a targeted heuristic to the layout engine, the kind of rule-on-rule complexity that accumulates when you are solving a real layout problem.
Version bumped from v0.7.0 to v0.8.0. All List 13 items either confirmed working or analytically tested. 2 153 tests passing.
The Agent Waves
The Secret Feature
Something I kept in my head until now: having the diagram in a machine-parsable format lets me automate Team Topologies advice. An enabling team doing XaaS is suspicious: it might be a bad idea unless that team is transitioning to another type. Handovers are warning signs. There are a small set of org-design problems you can detect directly from the diagram syntax, and now that it is parsable through mermaid's Jison grammar, I can wrap the input in detector code and ship automated organizational health checks.
Text-to-diagram was the stated goal. Machine-readable organizational topology was the hidden one.
The Cybernetic Loop
A cybernetic system uses feedback to self-correct toward a goal. This project was an exercise in designing feedback loops that actually converge.
The sensing mechanisms evolved:
- Sessions 1-2: Tests only (pass/fail)
- Sessions 3-7: Tests + Puppeteer screenshots (visual feedback, but brittle)
- Sessions 7-14: Tests + Puppeteer + 92-diagram combination matrix + lockdown tests (visual regression)
- Sessions 16-17: Tests + intersection testing (geometric invariant checking)
- Sessions 17-21: Tests + SVG DOM inspection + parametric general rules + SVG snapshots (deterministic, comprehensive, fast)
Each evolution tightened the loop. The specification became more precise, the sensing more reliable, the convergence faster. The Puppeteer-to-SVG pivot was the biggest single improvement: it replaced a slow, brittle, pixel-level sensing mechanism with a fast, deterministic, structure-level one.
The layout engine's 3 056 lines are the accumulated result of rules discovered through this loop. Each rule emerged from a specific failure in a specific diagram. The barycenter ordering came from visual confusion in cross-group interactions, the hub-source constraint came from me saying "retry" when Claude wanted to give up, the post-fixup width expansion came from enabling teams overshooting their partners. The complexity is real, not accidental.
Build Cost Comparison
The traditional cost (approximately 64 000 EUR) reflects a specific challenge: the intersection of deep Team Topologies domain knowledge, mermaid-js internals, and layout algorithm expertise is a combination you would struggle to hire for. The TT consultant role alone is niche. Finding someone who knows both TT semantics and computational geometry well enough to design the layout rules is close to impossible. That person, in this case, is me, and the AI handled the parts where my time-to-implementation would have been highest: the Jison grammar I could never quite learn, the boilerplate rendering code, the 2 153 tests I designed but did not type.
What This Shows
As the layout engine grew more complex, I kept hitting walls where the agent would output the same defect repeatedly. It could not see the problem, so it could not fix it. Each wall forced me to improve the feedback loop: first tests alone (pass/fail only), then Puppeteer screenshots (visual but brittle), then structured SVG inspection (deterministic and fast), then geometric invariants like "every interaction shape must intersect both teams" (catching entire classes of bugs with one rule). The pattern was consistent: I could only get the AI to solve more complex layout problems by giving it better ways to sense what was wrong. Tighten the feedback loop, not the prompt.
The layout engine started as a simple vertical stacker. Each real-world diagram exposed edge cases that required new rules: handover clusters, facilitation overlap modes, barycenter ordering, cross-group positioning, post-fixup width expansion, partner-aware centering, hub-source constraints. People who knew I was working on this underestimated the layers of rules on rules it has. The 3 056-line layout engine is not over-engineered. It is the minimum complexity for the actual problem space. I debated using a constraint solver but the exception-on-exception nature of layout rules made bespoke logic more honest.
The existing architecture was a feature, not an obstacle. Every diagram type in mermaid-js follows the same pattern, so Claude had reference implementations for every convention I needed to follow. The Jison grammar was the hardest part for me before Claude: multiple sources of documentation online conflict each other and there are competing versions that work in different ways. With Claude, that barrier dropped. Brownfield codebases give AI agents something greenfield projects do not: a template to build from.
217 prompts across 21+ sessions. Five corrections to the layout mental model in a single session. Three simultaneous regressions caught by visual inspection. A one-word "retry" that forced Claude past analysis paralysis into discovering a rule it had declared impossible. "No, you don't confirm what looks correct, I do." The human provides what the LLM cannot: the self-referential awareness that evaluates "is this converging on what I actually need?" Without that awareness, agents add code, not value.
The stated goal was text-to-diagram for Team Topologies. The unstated consequence: once an organizational topology is expressed in a formal grammar, you can run automated analysis on it, detecting anti-patterns, warning about handovers, flagging suspicious interaction modes. The diagram is not just a visualization; it is a data structure. Building inside mermaid-js's parser infrastructure made this possible for free.